black and brown leather padded tub sofa

Transforme sua gestão corporativa com inteligência.

Soluções inovadoras para otimizar sua empresa agora.

Controle de despesas

Reduza custos e otimize seus gastos corporativos.

Aumente a eficiência da sua equipe rapidamente.

Obtenha insights estratégicos em tempo real.

Viagens corporativas
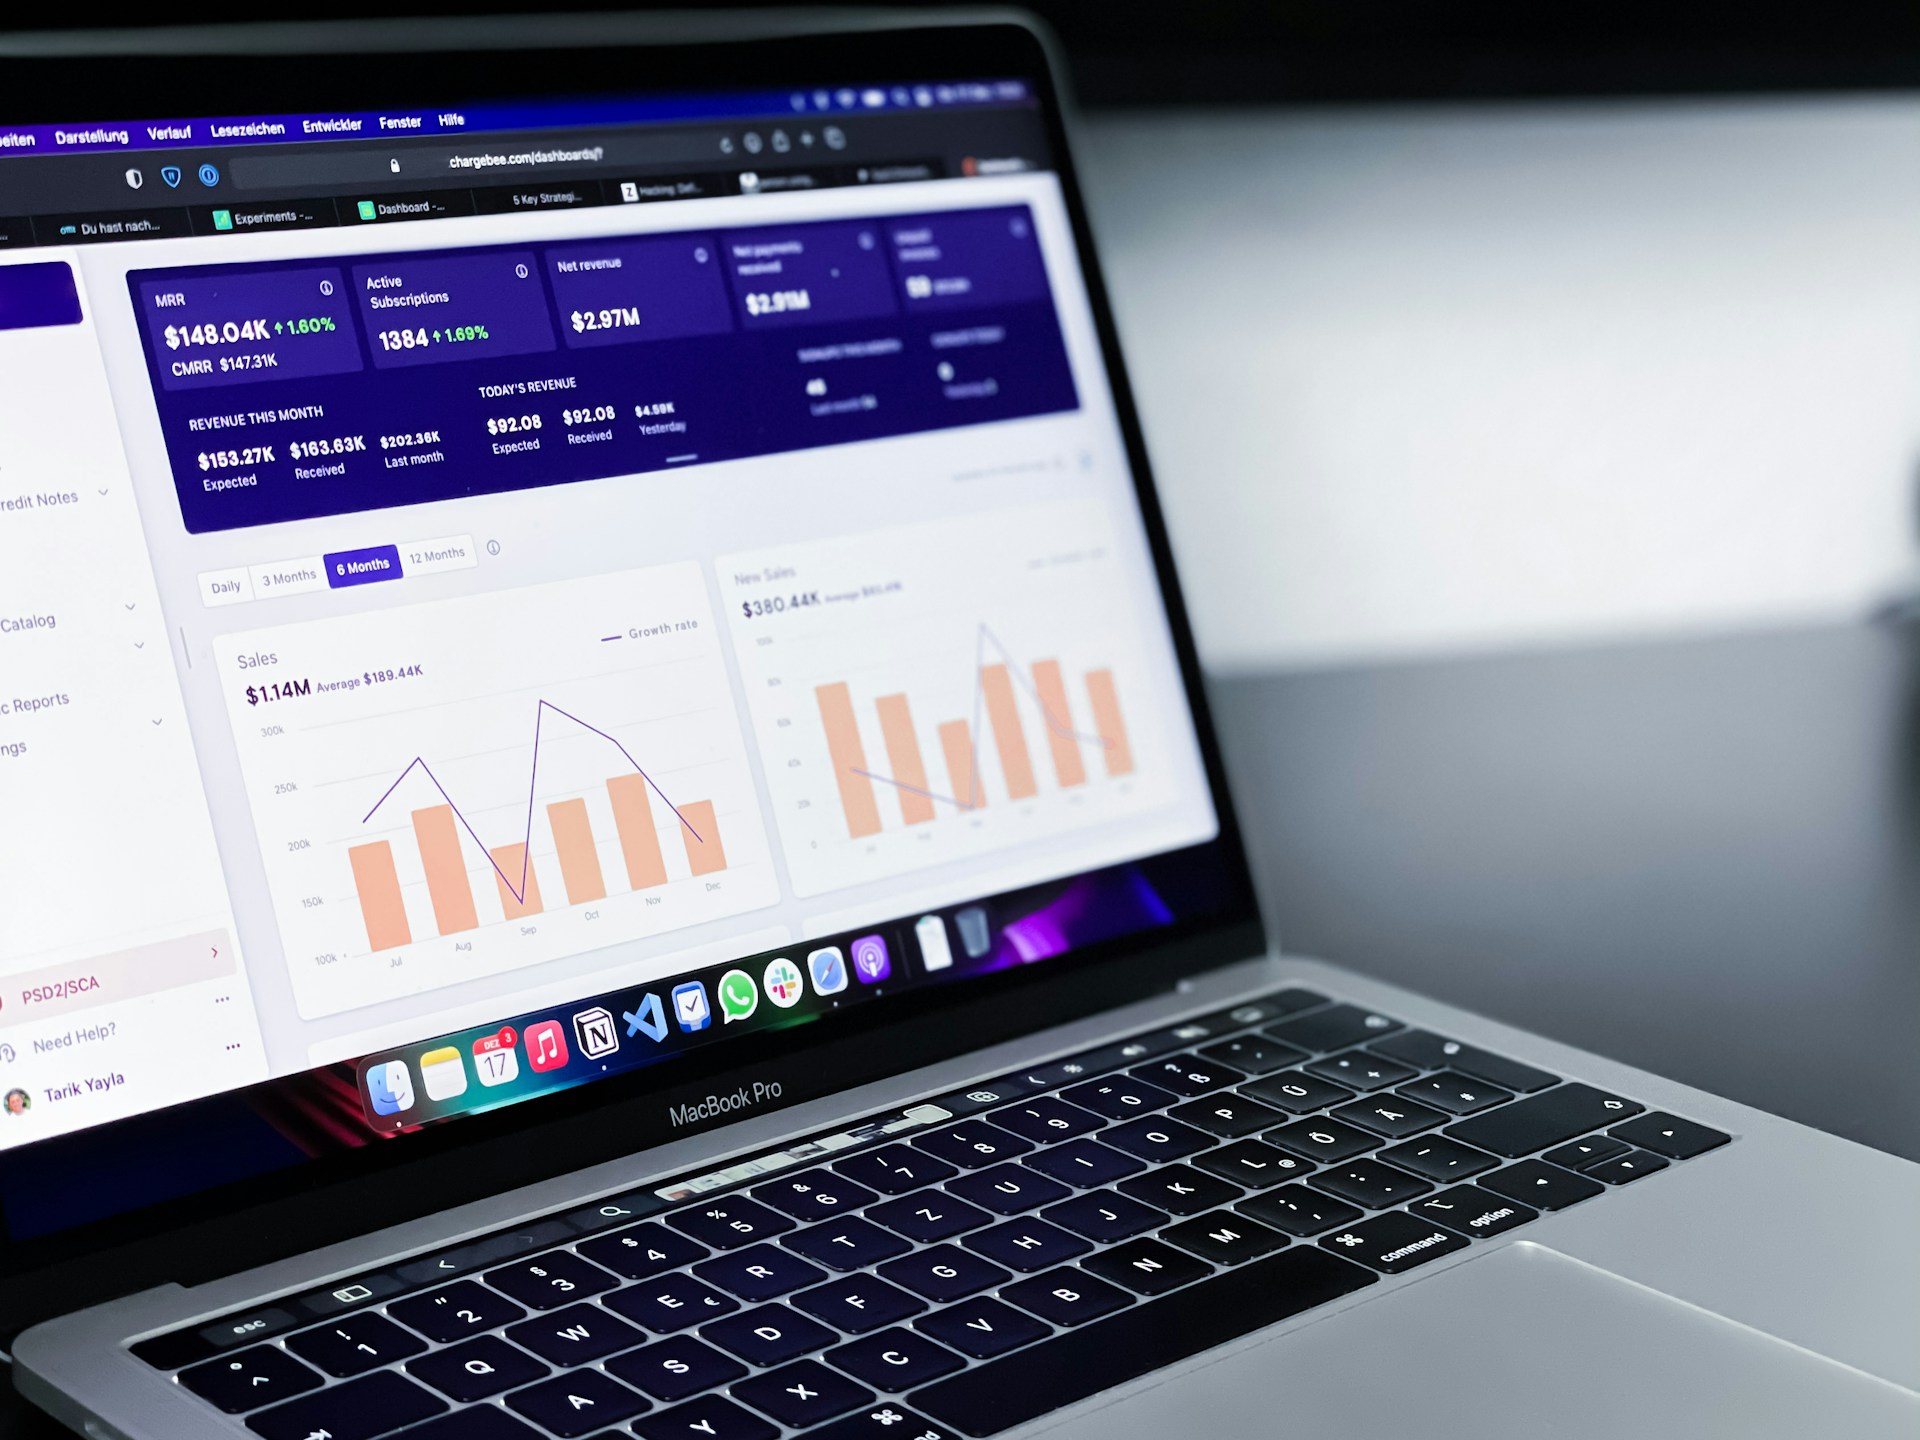
Análise de dados

Sobre a Taarifa

A Taarifa é uma plataforma inovadora que otimiza a gestão corporativa com inteligência conectada, reduzindo custos e aumentando a eficiência das empresas.

A small, round robot with a smooth white surface and blue accents operates a blue laptop on a sleek, floating platform. The robot has glowing eyes and an antenna on its head, with an 'AI' emblem on its front.
An iPad displaying data visualization content next to a book titled 'Data Science for Business.' The iPad is showing notes and a diagram about dashboard design, accompanied by a stylus placed between the iPad and the book.
A close-up view of a stack of books on a dark shelf, with the most prominent book having an orange cover and white bold text reading 'automate your busywork'. The bookshelf is modern and minimalist in style, placed against a wooden backdrop.

Nossa Missão

Oferecemos soluções em IA e automação, integrando-se a sistemas legados para proporcionar controle inteligente de despesas e análise de dados em tempo real.

Soluções Inteligentes

Otimize sua gestão corporativa com inteligência conectada e automação para reduzir custos e aumentar eficiência.

Análise de Dados

Obtenha insights estratégicos em tempo real para decisões mais informadas e eficazes em sua empresa.

A web page featuring a promotional message about creating mobile apps from data. The headline text emphasizes transforming data into beautiful, powerful mobile applications. Below the headline, there is an image of a smartphone interface displaying app previews with a toolbar and menu options. The user interface is sleek and modern with a soft pastel background gradient.
Automação Inteligente

Integre nossa tecnologia a sistemas legados e simplifique o controle de despesas e viagens corporativas.

Transforme sua gestão com soluções inovadoras que promovem eficiência e modernidade em processos corporativos.

Inovação Corporativa
A conference room setting with several laptops on a large table, each being used by a person. A large screen displays a blue interface with the text 'Generate ad creatives from any website with AI'. A stainless steel water bottle and a conference phone are also visible on the table.
A computer screen displaying a data analytics dashboard with graphs and charts. A blue line graph shows fluctuations in data over time, and a section highlights the number of page views. A pie chart is partially visible, indicating a breakdown of different data elements.
woman wearing yellow long-sleeved dress under white clouds and blue sky during daytime

A plataforma Taarifa transformou nossa gestão, aumentando a eficiência e reduzindo custos significativamente em nossa empresa.

João Silva

An abstract, pastel-colored, 3D-rendered representation of data analysis and search engine optimization (SEO). The image features a computer interface with various analytics symbols, including a magnifying glass, bar charts, pie charts, and a search bar with the text 'SEO'. Surrounding the interface are different objects such as a potted plant, a cup with a saucer, and a megaphone, all placed on a light green background.

Com a Taarifa, conseguimos insights estratégicos em tempo real, otimizando nossas decisões e processos internos.

Maria Costa

A small, white humanoid robot with blue accents, including eyes, mouth, and a circular badge with the letters 'AI' on its chest, is positioned in front of a blue laptop on a metallic surface. The robot has a simple, smooth design with two cylindrical arms and a small antenna on top.
★★★★★
★★★★★

Galeria

A promotional banner with a bold red background features the text 'Data has a better idea' in large white letters. Above the text, the word 'HIVERY' is printed along with a stylized logo resembling a beehive. The background also includes a pattern of blue circles and dots, giving a digital or technological feel. In the surrounding area, there's a partial view of a desk and some office supplies.
A modern, large, multi-story office building is prominently situated on a clear day, featuring the letters 'BCI' with a logo on its facade. The structure is surrounded by a well-maintained garden and a sidewalk where several people are walking. Nearby, cars are parked and some are driving along the street.
Four small, white robot figures are sitting in a row, each with a laptop in front of them. They have round bodies and blue accents, with 'AI' displayed on their chests. The background is minimal and light gray, emphasizing the robots and their computers.
A computer screen displaying analytics dashboards with various charts, including a line graph on the left and a cohort analysis table on the right. The table is populated with different shades of blue, indicating varying levels of user activity over several weeks. Text labels and numbers detail user retention statistics.
A person wearing a business suit is interacting with a tablet on a desk. The desk is cluttered with papers showing charts, a notebook, a pen, and a mug. A calculator is also visible, and there is a potted plant in the background.
A laptop displaying a dashboard with various graphs, charts, and numeric data. The screen is partially visible, showcasing sections with line graphs, financial figures, and small images. The background is blurred with a prominent red light creating a warm ambiance.

Descubra soluções inovadoras para gestão corporativa e eficiência.